I spent the last 5 years working as a pollster so I saw a lot of banner books - big hulking books filled with crosstabulations. Crosstabs, for those unfamiliar, display the distributions of survey responses by different groups within your data. I conditioned myself to read and understand crosstabs, that's now the way I think about data and find patterns in data. As I've started doing more work in data science in Python (and Pandas more specifically), one of the first things I figured out was how to recreate crosstabs.

"Do you think the country is going in the right direction or is it off on the wrong track?"
In the example at right, the survey responses to direction of the country is shown among the overall survey population, but also by respondents in each age group. This format makes it really easy to pick out ways that groups behave differently, hold different opinions, or might be more receptive to one candidate's message than other groups.
A simple pandas crosstab
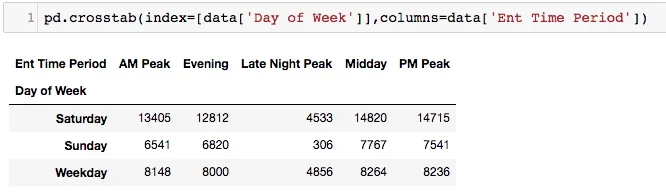
Pandas offers the crosstab function that offers loads of customization, similar in many ways to Excel's pivot table. In its most simple form, feeding pd.crosstab an index and a column will return counts of the index/column's appearance in your dataset, like below. Honestly, not the most interesting nor the most useful. This is where the pd.crosstab's other parameters really amplify the power of crosstabulation.
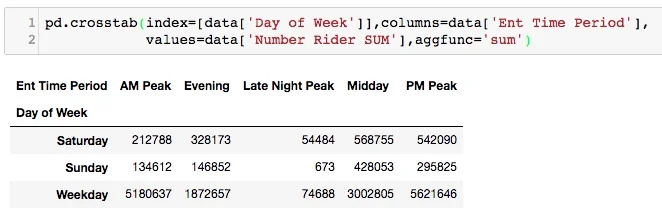
Ridership totals for each day of the week and time of day.
The values parameter allows you to set the variable to tabulate over. For example, the dataset I'm working with is 1 month of WMATA ridership data, with the ridership volume summarized by station origin and destination, by time of the day and of the week. A far more useful crosstab would be look to at the number of rides taken during time of the day and day of the week. The aggfunc (aggregate function) allows you to specify the operation that applies to values. If aggfunc is specified, then values must also be specified.
For my WMATA data, I want to add all point-to-point rides that occur over the time period to better understand the system's ridership patterns.
I find this more helpful for finding differences in ridership volume. It immediately jumps out that no one rides the metro during Sunday's Late Night Peak, and Late Night Peak has much lower ridership than other times. Part of what made the crosstabs I looked at as a pollster so compelling was that everything was displayed as percentages, rather than absolute numbers.
Here comes the fun part.